A communications team spends weeks on a policy rollout: a homepage banner, a news post, a reminder email. Three months later, someone asks a simple question in a leadership meeting: did it work? The honest answer, for most organizations, is “we’re not sure.” SharePoint shows page views. It doesn’t show whether the message landed.
That gap between “people visited the page” and “people actually understood or acted on it” is one of the most common blind spots in internal communications, and it’s worth understanding exactly where SharePoint’s native analytics stop being useful, before assuming a bigger reporting problem needs a bigger fix than it actually does.
What SharePoint’s Built-In Reporting Actually Measures
SharePoint’s analytics aren’t broken or missing, they’re just narrower than most communicators expect. At the page level, SharePoint reports show total views, unique viewers, and average time spent, along with traffic patterns by hour. At the site level, you get a usage dashboard showing overall traffic and how visitors are arriving. Both are accessible directly from the page or site settings, and both are genuinely useful for a specific question: is this piece of content getting looked at?
That’s the key word: looked at. SharePoint’s reporting was built around document libraries and general site activity, not around the specific question a communications team usually cares about, which is whether a message resonated, was understood, or changed behavior. The data is real and accurate. It’s just answering a narrower question than the one most people are actually asking.
Why the Data Feels Scattered Even When It’s Accurate
The bigger frustration usually isn’t the metrics themselves, it’s how hard they are to pull together into a single picture. If your CEO’s quarterly update lives on one site and your benefits reminder lives on another, comparing their performance means opening two separate reports and doing the math by hand. Multiply that across a dozen sites and even a simple question, like which type of content performs best across the whole intranet, turns into a manual research project.
There’s also a retention limit worth knowing about: SharePoint’s usage data typically only covers a rolling 90-day window. That’s fine for evaluating last month’s announcement, but it makes year-over-year or seasonal trend analysis difficult unless someone is actively exporting and archiving that data on a regular schedule. Most communications teams don’t have that on their to-do list, which means valuable historical patterns quietly disappear.
The Questions Native Analytics Can’t Answer
Even with perfect data hygiene, there are questions SharePoint’s built-in tools simply weren’t designed to answer. Views and time-on-page tell you engagement happened, but not whether the content was understood, whether it changed a decision, or whether the right audience actually saw it versus just anyone who stumbled across the link. A page can show strong traffic and still fail at its actual job if the people who needed to see it never did.
Cross-site, organization-wide reporting is the other consistent gap. Leadership rarely asks, “how did this one page perform.” Instead, they ask, “how is our intranet doing overall,” or “which topics are resonating across the organization this quarter.” SharePoint’s page-by-page structure makes that kind of aggregate view genuinely hard to produce without pulling data into another tool.
Turning Page Views Into Decisions Instead of Just Numbers
None of this means the data is useless, it means it needs a bit of discipline to turn into something actionable. A few habits make a real difference:
1. Compare similar content types to each other rather than comparing a policy page to a news article, since they naturally perform differently and neither is inherently better.
2. Look for trends over several weeks rather than reacting to any single day’s numbers, since normal fluctuation gets misread as a real signal far more often than it should.
3. Decide what success looks like before you measure it: broad awareness campaigns should be judged on unique visitors, while in-depth resources are better judged on time spent and return visits.
The habit that matters most, and gets skipped most often, is actually acting on what the data shows. A page with declining engagement over several months is a signal that content is going stale, not just a number to note and move past. Analytics that never lead to a content decision are just data collection.
When Native Reporting Stops Being Enough
At some point, usually once an intranet spans multiple sites and multiple stakeholder groups, native SharePoint analytics reach their practical ceiling, not because the data is wrong, but because pulling it into one coherent, ongoing view takes more manual effort than most teams can sustain. There are a few reasonable paths forward from there, and the right one depends on what the organization actually needs.
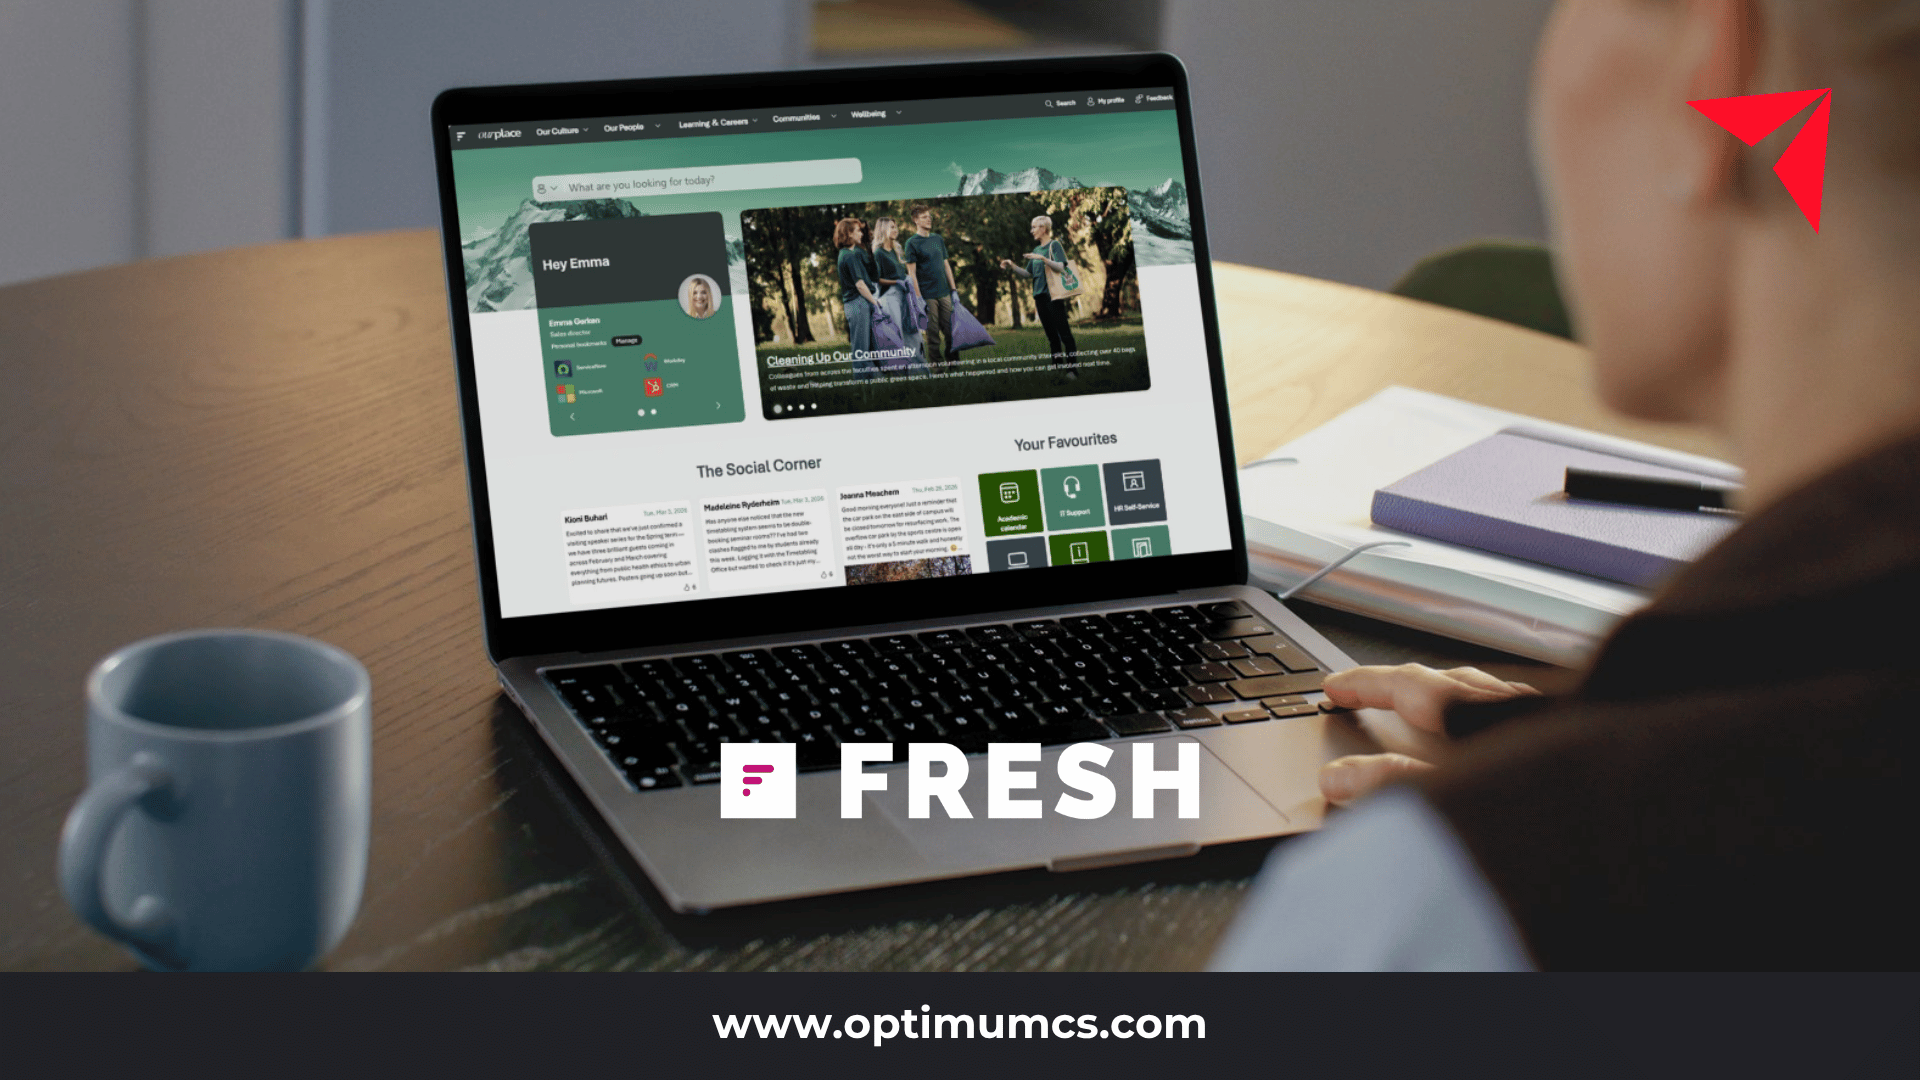
For organizations that want deeper, purpose-built reporting inside their intranet experience itself, a platform like Fresh Intranet extends SharePoint’s native capabilities with communicator-focused analytics designed around cross-site patterns rather than page-by-page lookups. For organizations that already have broader business intelligence needs, connecting SharePoint data into Power BI or Microsoft Fabric offers a more customizable path, especially if intranet engagement needs to sit alongside other organizational metrics in the same reporting environment. Neither path is universally right. The decision usually comes down to whether the goal is a better intranet experience specifically, or a broader analytics capability that happens to include the intranet.
Looking To Improve Your SharePoint Analytics?
Want a clearer picture of what your intranet analytics are actually telling you? Talk to Optimum about your Fresh Intranet or SharePoint reporting options and find out whether native reporting, a platform upgrade, or a BI integration fits your organization best.
About Optimum
Optimum is a nationally recognized IT consulting firm and an official partner across the full employee communications and digital workplace stack, including Microsoft as a Solutions Partner for AI Business Solutions, SharePoint, ShortPoint, Fresh Intranet, Staffbase, and ScreenCloud. We help organizations connect intranet, email, employee apps, and digital signage into one integrated communications strategy, backed by deeper AI, data, and automation capabilities across Power Platform, Copilot, and Microsoft Fabric.
Our services span strategy and assessment, implementation, migration, governance, and ongoing managed support, with a focus on maximizing the ROI of your existing platform investments and driving real adoption, not just a successful launch. Whether your workforce is desk-based, frontline, deskless, or spread across all three, we help you reach every employee on the channel that actually works for them.
We offer a free Intranet Migration Assessment for organizations evaluating a move to Staffbase, Fresh Intranet, or a modernized SharePoint environment. Reach out today and let’s explore the right combination of channels for your organization!
Contact us: info@optimumcs.com | 713.505.0300 | www.optimumcs.com
Frequently Asked Questions About SharePoint Analytics
What does SharePoint analytics actually track?
SharePoint’s built-in analytics track page views, unique visitors, average time spent on a page, and traffic patterns by hour, available at both the individual page level and the overall site level. These reports live in the page’s command bar and in the site’s usage settings, and they update based on recent activity rather than requiring any separate setup. They’re accurate for measuring whether content was accessed, but they don’t measure comprehension, sentiment, or whether the content reached its intended audience.
How long does SharePoint keep usage data?
SharePoint’s native usage reports generally cover a rolling 90-day window. If your organization needs to analyze trends across a full year or compare performance season to season, that data needs to be exported and archived manually on a regular basis, since it isn’t retained indefinitely inside SharePoint itself.
Can I compare analytics across multiple SharePoint sites?
Not easily using SharePoint’s native tools alone. Site-level and page-level reports are scoped to one site at a time, so comparing content performance across multiple sites requires manually pulling reports from each one and combining them, which becomes impractical as the number of sites grows. This is one of the more common reasons organizations look at a purpose-built intranet platform or a Power BI integration for reporting.
Why does a page show high views but seem to have no real impact?
Page views measure access, not comprehension or action. A page can be viewed frequently because it’s linked from the homepage or shows up in search, without the content actually being read, understood, or acted on. That’s why time on page and return visits are often more informative than raw view counts, and why some organizations pair intranet analytics with direct feedback channels to understand actual impact.
Do I need a third-party tool to get useful intranet analytics?
Not necessarily. Many organizations get real value from SharePoint’s native reporting once they build a habit of comparing similar content types, tracking trends over time, and tying metrics to specific goals. A third-party platform or a Power BI integration becomes more valuable once an organization needs cross-site reporting, longer data retention, or analytics tailored specifically to communications rather than general site activity.